How to get core dump in a Docker container
One of the most dreaded errors to see while programming with C++ is the segmentation fault. Until recently, I had been mostly relying on one of these three things to debug this problem: stack trace printed out by the signal handler of the Google glog library, AddressSanitizer, and the gdb.
A couple of days ago, I found myself in a situation where none of these really worked. The system I was testing had multiple Docker containers running on different machines. When the segfault happened, no stack trace was printed and re-running the binary with AddressSanitizer did not produce anything (I later found that the glog signal handler seemed to interfere with Asan so I might have got something from Asan if I disabled glog’s signal handler first). I could have used gdb but in order to incorporate that into my automated workflow, I had to bloat my Docker image with gdb and its dependencies.
The complete error message of a segfault was usually Segmentation fault (core dumped), which made me wondered if the core dump could help, where to find it, and how to extract information from it. Unsurprisingly, the core dump also contained the stack trace at time of crash but what I didn’t know was that one could easily be read with gdb!
You can find many guides on the Internet for how to get and read a core dump (like this one). However, obtaining one from a Docker container is a bit more convoluted:
- Before starting the container, run the following command to specify where to dump the core file
echo '/tmp/core.%e.%t' | sudo tee /proc/sys/kernel/core_patternHere is a list of specifiers that can be used in the core file name. A full list can be found here.
%e Executable name %h Hostname %p PID of dumped process %s Signal causing dump %t Time of dump %u UID %g GID - When running the container, add the following options:
-
--ulimit core=<core size>sets the maximum size of a core dump. For unlimited size, usecore=-1. -
--mount type=bind,src=/tmp,target=/tmpmounts the/tmpdirectory on the host machine to the/tmpdirectory inside the container.
-
After your program crashes, you can find the core dump in /tmp.
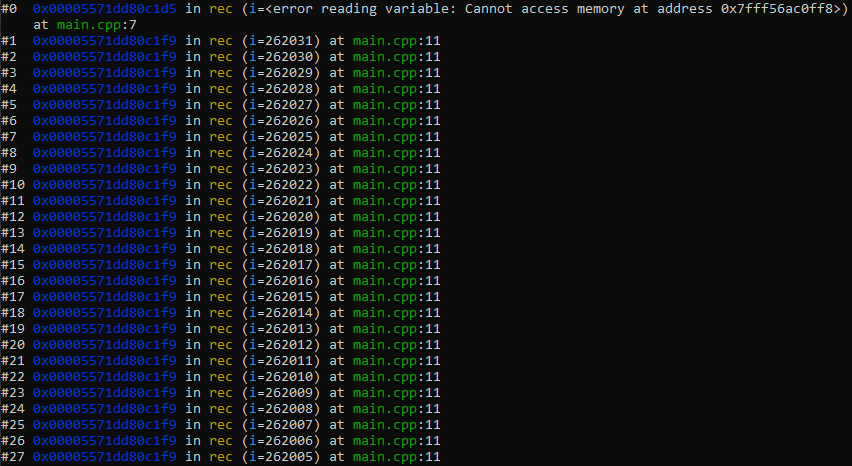
If you need a buggy program to test this out, here is one. This code contains the same problem that I had in the situation mentioned above.
#include <iostream>

using namespace std;

long long int rec(long long int i) {
  if (i == 100000000) {
    return i;
  }
  return rec(i + 1);
}

int main() {
  cout << rec(0) << endl;
}
Output by gdb on the core dump indicated that the recursion was too deep, leading to stack overflow.